 Share
ShareIf you care about site performance, please stop adding your redirects to .htaccess files!
For anyone who doesn’t know, a .htaccess file is a text file that can be placed in a directory within your website files, allowing you to make some changes to the configuration of your site without having to mess around with altering the server configuration files.
I’ve been saying it to my colleagues for years – “Don’t put loads of redirects in .htaccess, it’ll just slow the site down” but never had any actual evidence to back that claim up.
To me, it just felt like common sense. If you’re opening a file, parsing it, and then applying the directives within it to every request that comes into a site, then it’s going to slow things down. And of course, every request is not just the page request, it’s also every resource request resulting from that page, such as Cascading Style Sheet (CSS) files, JavaScript (JS) files, and every image.
I was curious about how much of an impact .htaccess files can actually have on the speed of a site, so I decided to run a few simple tests to try and gain some understanding of how much difference it can make. In this blog, we take a look at how much impact having your redirects in your .htaccess file as opposed to the server configuration can make.
The architecture and software I used
To test this, I created two really basic droplets at Digital Ocean. For each droplet, I went for the cheapest option available – $5/month, giving 1GB RAM, 1 CPU, and a 25GB SSD to each. Both droplets are located in London, both running Ubuntu 18.04.3 (LTS) x64.
The first droplet (named ‘dante’ after one of my cats) was set up as a simple webserver, running Apache 2.4.29-1ubuntu4.11. No PHP, no extra modules, or anything to complicate or distort the results.
The second droplet, called ‘shadow’ (also named after one of my cats) had apache2-utils installed, and no extra packages other than the defaults from Digital Ocean. I would use this server as the client for the benchmarking tests.
Both droplets had private networking enabled, so that benchmarking would run over the DigitalOcean internal network – I hoped that would be less susceptible to any bandwidth fluctuations which could otherwise occur on the connection from my computer to the servers.
This test was all about keeping things simple, so I decided to stick to the classic Apache Benchmarking tool ‘ab’. To get results over a meaningful sample size of requests, I decided to set the number of requests to 1,000,000 and to make sure those requests didn’t take too long to run, I also set the concurrency to 100.
Between each test, I restarted Apache fully, just to rule out any cumulative effects that could otherwise lurk somewhere and distort the results.
The tests
The first test I did was as basic as can be. I set AllowOverride to none (to disable .htaccess), with no redirects in the Apache configuration.
These were the results:
root@jd-shadow:~# ab -n 1000000 -c 100 http://dante/
This is ApacheBench, Version 2.3 <$Revision: 1807734 $>
Copyright 1996 Adam Twiss, Zeus Technology Ltd, http://www.zeustech.net/
Licensed to The Apache Software Foundation, http://www.apache.org/

Benchmarking dante (be patient)
Completed 100000 requests
Completed 200000 requests
Completed 300000 requests
Completed 400000 requests
Completed 500000 requests
Completed 600000 requests
Completed 700000 requests
Completed 800000 requests
Completed 900000 requests
Completed 1000000 requests
Finished 1000000 requests

Server Software:        Apache/2.4.29
Server Hostname:        dante
Server Port:            80

Document Path:          /
Document Length:        174 bytes

Concurrency Level:      100
Time taken for tests:   287.885 seconds
Complete requests:      1000000
Failed requests:        0
Total transferred:      444000000 bytes
HTML transferred:       174000000 bytes
Requests per second:    3473.61 [#/sec] (mean)
Time per request:       28.788 [ms] (mean)
Time per request:       0.288 [ms] (mean, across all concurrent requests)
Transfer rate:          1506.14 [Kbytes/sec] received

Connection Times (ms)
min  mean[+/-sd] median   max
Connect:        0    1   1.2      1      49
Processing:     6   28   2.1     28      60
Waiting:        5   28   2.1     28      60
Total:         14   29   1.6     29      66


Percentage of the requests served within a certain time (ms)
50%     29
66%     29
75%     29
80%     29
90%     30
95%     31
98%     34
99%     36
100%    66 (longest request)
The most relevant values in that data are the values for Time per Request of 0.288ms, and Requests per Second of 3473.61. From here on, we’ll call them TpR and RpS respectively.
When we set AllowOverride to All, which allows the use of .htaccess but don’t actually add a .htaccess file to the document root, we see this:
root@jd-shadow:~# ab -n 1000000 -c 100 http://dante/
[snip]
Concurrency Level:      100
Time taken for tests:   299.161 seconds
Complete requests:      1000000
Failed requests:        0
Total transferred:      444000000 bytes
HTML transferred:       174000000 bytes
Requests per second:    3342.68 [#/sec] (mean)
Time per request:       29.916 [ms] (mean)
Time per request:       0.299 [ms] (mean, across all concurrent requests)
Transfer rate:          1449.36 [Kbytes/sec] received

Connection Times (ms)
min  mean[+/-sd] median   max
Connect:        0    1   0.6      1      25
Processing:     6   29   1.5     29      60
Waiting:        6   29   1.5     29      54
Total:         13   30   1.3     30      60

Percentage of the requests served within a certain time (ms)
50%     30
66%     30
75%     30
80%     30
90%     31
95%     31
98%     34
99%     36
100%     60 (longest request)
TpR has increased a little to 0.299ms, and RpS has decreased a little to 3342.68.
This is to be expected – Apache is now having to scan directories looking for the presence of a .htaccess file. There is, of course, an overhead to that. Not huge, but still present nevertheless.
I then added an empty .htaccess file to the document root. In this situation, Apache will now be scanning for the presence of .htaccess and then opening the file, parsing, and closing it. It’s reasonable to expect a further increase in TpR, and a reduction in RpS.
root@jd-shadow:~# ab -n 1000000 -c 100 http://dante/

[snip]
Concurrency Level:      100
Time taken for tests:   310.657 seconds
Complete requests:      1000000
Failed requests:        0
Total transferred:      444000000 bytes
HTML transferred:       174000000 bytes
Requests per second:    3218.98 [#/sec] (mean)
Time per request:       31.066 [ms] (mean)
Time per request:       0.311 [ms] (mean, across all concurrent requests)
Transfer rate:          1395.73 [Kbytes/sec] received

Connection Times (ms)
min  mean[+/-sd] median   max
Connect:        0    1   1.0      1      41
Processing:     6   30   1.7     30      83
Waiting:        5   30   1.7     30      83
Total:         14   31   1.6     31      84

Percentage of the requests served within a certain time (ms)
50%     31
66%     31
75%     31
80%     31
90%     32
95%     33
98%     36
99%     39
100%     84 (longest request)
TpR has increased to 0.311ms, and RpS has decreased to 3218.98.
Next, I added a single, simple redirect to the .htaccess file. It’s not a redirect that will match our request, but Apache will still have to open the file, read the rule, and see if it applies to our request.
The rule I used was simply:
Redirect “/1.html” “/index.html”
root@jd-shadow:~# ab -n 1000000 -c 100 http://dante/
[snip]
Concurrency Level:      100
Time taken for tests:   323.729 seconds
Complete requests:      1000000
Failed requests:        0
Total transferred:      444000000 bytes
HTML transferred:       174000000 bytes
Requests per second:    3089.00 [#/sec] (mean)
Time per request:       32.373 [ms] (mean)
Time per request:       0.324 [ms] (mean, across all concurrent requests)
Transfer rate:          1339.37 [Kbytes/sec] received

Connection Times (ms)
min  mean[+/-sd] median   max
Connect:        0    1   1.2      1     199
Processing:     9   32   3.6     31    2702
Waiting:        8   32   3.6     31    2702
Total:         17   32   3.7     32    2702

Percentage of the requests served within a certain time (ms)
50%     32
66%     32
75%     32
80%     33
90%     33
95%     36
98%     39
99%     40
100%   2702 (longest request)
TpR has now gone to 0.324ms, with RpS now at 3089.
At this point, I added 100 rewrites to the .htaccess. Again, very simple rewrites of the form:
Redirect “/1.html” “/index.html”
Redirect “/2.html” “/index.html”
root@jd-shadow:~# ab -n 1000000 -c 100 http://dante/
[snip]
Concurrency Level:      100
Time taken for tests:   507.222 seconds
Complete requests:      1000000
Failed requests:        0
Total transferred:      444000000 bytes
HTML transferred:       174000000 bytes
Requests per second:    1971.52 [#/sec] (mean)
Time per request:       50.722 [ms] (mean)
Time per request:       0.507 [ms] (mean, across all concurrent requests)
Transfer rate:          854.84 [Kbytes/sec] received

Connection Times (ms)
min  mean[+/-sd] median   max
Connect:        0    1   1.1      1     138
Processing:     7   50   4.5     49    3137
Waiting:        7   50   4.5     49    3137
Total:         15   51   4.6     50    3137

Percentage of the requests served within a certain time (ms)

50%     50
66%     50
75%     51
80%     51
90%     53
95%     56
98%     60
99%     61
100%   3137 (longest request)
TpR is now up to 0.507ms, and RpS is now down to 1971.52. At this point, I was curious to see what 1000 redirects would do to our times:
root@jd-shadow:~# ab -n 1000000 -c 100 http://dante/
[snip]
Concurrency Level: 100
Time taken for tests: 2144.179 seconds
Complete requests: 1000000
Failed requests: 0
Total transferred: 444000000 bytes
HTML transferred: 174000000 bytes
Requests per second: 466.38 [#/sec] (mean)
Time per request: 214.418 [ms] (mean)
Time per request: 2.144 [ms] (mean, across all concurrent requests)
Transfer rate: 202.22 [Kbytes/sec] received

Connection Times (ms)
min mean[+/-sd] median max
Connect: 0 1 0.9 1 31
Processing: 2 213 275.6 160 7895
Waiting: 2 151 243.6 80 7716
Total: 3 214 275.7 161 7896

Percentage of the requests served within a certain time (ms)
50% 161
66% 266
75% 326
80% 368
90% 484
95% 593
98% 753
99% 933
100% 7896 (longest request)
TpR has now jumped to 2.144 ms, and RpS has plummeted down to just 466.38.
I then moved those redirects into the site’s configuration file, and set AllowOverride back to None, to turn off .htaccess processing.
With those 1000 redirects in the configuration file:
root@jd-shadow:~# ab -n 1000000 -c 100 http://dante/
[snip]
Concurrency Level:      100
Time taken for tests:   309.263 seconds
Complete requests:      1000000
Failed requests:        0
Total transferred:      444000000 bytes
HTML transferred:       174000000 bytes
Requests per second:    3233.49 [#/sec] (mean)
Time per request:       30.926 [ms] (mean)
Time per request:       0.309 [ms] (mean, across all concurrent requests)
Transfer rate:          1402.02 [Kbytes/sec] received
Connection Times (ms)

min  mean[+/-sd] median   max
Connect:        0    1   1.3      1      42
Processing:     6   30   2.2     30      61
Waiting:        5   30   2.2     30      61
Total:         12   31   1.8     31      68

Percentage of the requests served within a certain time (ms)
50%     31
66%     31
75%     31
80%     31
90%     32
95%     33
98%     37
99%     39
100%     68 (longest request)
We see a far healthier TpR of 0.309ms, with RpS of 3233.49. These values are quite close to the values we saw very early on when we had no redirects in place at all.
Quite clearly (and unsurprisingly), the overhead of reading and parsing of a .htaccess file with several redirects in it is high.
When the rules are read at server start up and then just applied to each request as it comes in, the overhead of actually applying those rules to the request is tiny.
With the 100 redirects in site configuration rather than in the .htaccess, we get these values:
root@jd-shadow:~# ab -n 1000000 -c 100 http://dante/
[snip]
Concurrency Level:      100
Time taken for tests:   293.709 seconds
Complete requests:      1000000
Failed requests:        0
Total transferred:      444000000 bytes
HTML transferred:       174000000 bytes
Requests per second:    3404.73 [#/sec] (mean)
Time per request:       29.371 [ms] (mean)
Time per request:       0.294 [ms] (mean, across all concurrent requests)
Transfer rate:          1476.27 [Kbytes/sec] received
Connection Times (ms)
min  mean[+/-sd] median   max
Connect:        0    1   0.7      1      26
Processing:     5   29   1.6     29      49
Waiting:        5   29   1.6     29      49
Total:         13   29   1.7     29      69

Percentage of the requests served within a certain time (ms)
50%     29
66%     29
75%     30
80%     30
90%     30
95%     31
98%     35
99%     37
100%     69 (longest request)
TpR is now down to 0.294 ms, with RpS up at 3404.73.
Comparing those figures with those we had when the 100 redirects were in .htaccess (TpR=0.507ms, RpS=1971.52), we see that we’re getting 72% more requests per second by not using .htaccess.
And with just the one redirect in the configuration file:
root@jd-shadow:~# ab -n 1000000 -c 100 http://dante/
[snip]
Concurrency Level:      100
Time taken for tests:   292.544 seconds
Complete requests:      1000000
Failed requests:        0
Total transferred:      444000000 bytes
HTML transferred:       174000000 bytes
Requests per second:    3418.29 [#/sec] (mean)
Time per request:       29.254 [ms] (mean)
Time per request:       0.293 [ms] (mean, across all concurrent requests)
Transfer rate:          1482.15 [Kbytes/sec] received

Connection Times (ms)
min  mean[+/-sd] median   max
Connect:        0    1   3.4      1      45
Processing:     6   28   3.7     28      63
Waiting:        6   28   3.7     28      63
Total:         12   29   6.5     29      99

Percentage of the requests served within a certain time (ms)
50%     29
66%     29
75%     29
80%     30
90%     31
95%     35
98%     51
99%     68
100%     99 (longest request)
TpR is now at 0.293ms and RpS up at 3418.29
I then ran the original test again, as a control, to check that nothing else was happening that might be having a cumulative effect somewhere I hadn’t considered, impacting the numbers:
[snip]
Concurrency Level:      100
Time taken for tests:   293.094 seconds
Complete requests:      1000000
Failed requests:        0
Total transferred:      444000000 bytes
HTML transferred:       174000000 bytes
Requests per second:    3411.88 [#/sec] (mean)
Time per request:       29.309 [ms] (mean)
Time per request:       0.293 [ms] (mean, across all concurrent requests)
Transfer rate:          1479.37 [Kbytes/sec] received

Connection Times (ms)
min  mean[+/-sd] median   max
Connect:        0    1   1.3      1      25
Processing:     5   28   2.0     28      50
Waiting:        5   28   2.0     28      50
Total:         11   29   2.7     29      61

Percentage of the requests served within a certain time (ms)
50%     29
66%     29
75%     30
80%     30
90%     32
95%     36
98%     38
99%     40
100%     61 (longest request)
TpR of 0.293 ms, with RpS of 3411.88.
That compares with a TpR of 0.288ms and RpS of 3473.61 from our first test (1.73% and -1.80% difference respectively) which feels close enough to our original values to rule out anything unconsidered having a cumulative effect somewhere.
The Results…
Summarising all of that data into one handy table, we see this:
| Time per Request | Requests per Second | |
| First control (no redirects, no .htaccess) | 0.288 | 3473.61 |
| AllowOverride set to All, no .htaccess | 0.299 | 3342.68 |
| AllowOverride set to All, empty .htaccess | 0.311 | 3218.98 |
| AllowOverride set to All, 1 redirect | 0.324 | 3089.00 |
| AllowOverride set to All, 100 redirects | 0.507
|
1971.52 |
| AllowOverride set to All, 1000 redirects | 2.144 | 466.38 |
| AllowOverride set to None. 1000 redirects in the config file | 0.309 | 3233.49 |
| AllowOverride set to None. 100 redirects in the config file | 0.294 | 3404.73 |
| AllowOverride set to None. 1 redirect in the config file | 0.293 | 3418.29 |
| Final Control (no redirects, no .htaccess) | 0.293 | 3411.88 |
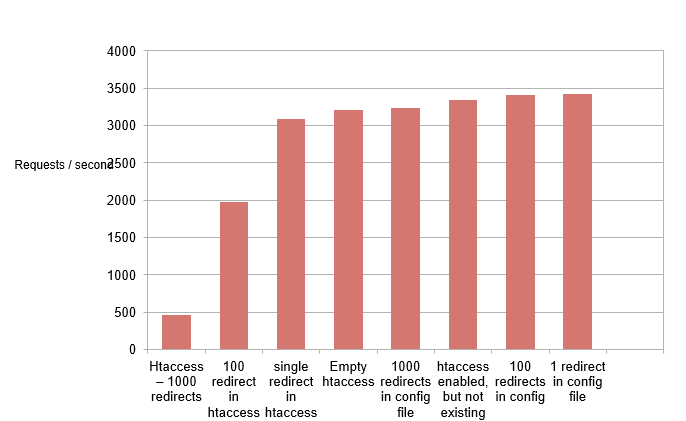
Graphing the requests/second figure, we can see that a single redirect in .htaccess doesn’t really have a huge impact on the requests/second figure. But when we get to 100 redirects in .htaccess we see a considerable drop in our requests/second figure:
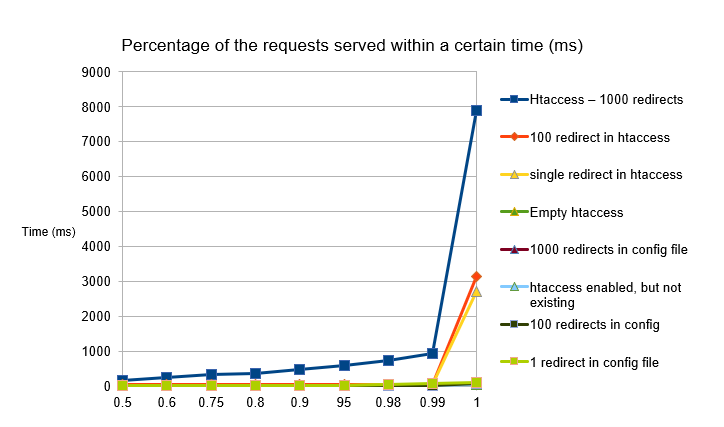
And when we look at latency, we see that having 1000 redirects in a .htaccess is a really bad idea!
We see latency increasing early on when we have 1000 redirects and are seeing it begin to increase for the 100 and 1 redirect (though only for a small number of requests).
Don’t forget though that these are really simple pages, you will almost certainly have a CMS in place, with attendant database queries, images, CSS, JavaScript, etc. all adding in to make things worse!
Final thoughts
So, in summary – Yes, as we sys-admins have been saying to developers for years, it really does make a difference, a sizable difference at times, moving your rewrites (and really, anything else as well) out of your .htaccess files into the apache configuration files.
Sure, it can make deployments a bit trickier at times, and you probably won’t have write access to the configuration files, so you’ll need to ask your friendly sys-admin for help. But it can make a real difference in site times and server load.
To speak to our experts and find out how we can improve your site performance, get in touch today!