 Share
ShareLet me start by saying I learned much more than just three things at this year’s Hero Conf London, but three key themes permeated most talks over the course of two days. “But what are those themes?” I hear you ask. Well, I shall tell you:
- Attribution
- Attribution
- Attribution
Ok I lied straight off the bat! There’s really only one theme, but I feel so passionately about it that I had to repeat it thricely!
Hopefully, most of you reading this will already be thinking about attribution to some degree. But it was reassuring to attend Hero Conf and listen to passionate digital marketers talk at great length as to why nailing it is so vital to success, not just for PPC, but for marketing in general.
What is Hero Conf?
Hero Conf 2019 is a two-day PPC event in St Pauls, London. The exhibition boasts 40+ wise and sage experts, dispelling their wisdom and providing actionable insights that you can choose to either take back to the office and share with your colleagues, or just hoard to yourself like some kind of greedy PPC pig!
The conference prides itself on booking speakers who tell the truth, not those wanting to give a sales pitch on their agency or some new, sparkly tool. In short, people who don’t wish to crush you to death under the weight of infinite sales calls and emails.
Side note, the food was INCREDIBLE; breakfast, snacks and lunch were all on another level compared to other events I’ve attended. What’s more, there was merchandise, boundless and plentiful merchandise. And I’m not ashamed to say that I hoovered a ton of it up and handed it out to my office pals like some kind of hipster Santa Claus arriving three months too soon.

Attribution, Attribution, Attribution
If you’re in marketing and you’re not thinking about attribution, then you’re doing it wrong. Honestly, I’m not going to hold back here, if you hear the word “attribution” and sigh then you should probably leave immediately…
Now that they’ve gone, let’s continue!
Understanding the conversion journey
An incredibly powerful facet of marketing to understand for any channel but especially so for paid advertising; understanding attribution gives you the ability to look beyond purely last click and dig into the detail of complex (and simple) conversion journeys that users are undertaking on your website.
Every website has some sort of conversion funnel, where users can enter at different phases in their buying cycle and will eventually end up as a consumer by making a purchase/form submission/download/whatever your business counts as a conversion.
Tinkering with attribution allows you to understand the role that marketing channels (both online and offline) play in each conversion journey. The problem is that even the best attribution models aren’t foolproof.
For example…
Let’s say you sell shoes, and your users can fall into these buckets:
- I want shoes.
- I want shoes, I know which brand.
- I want shoes, I know which brand, but I don’t know which colour.
- I want shoes, I know which ones, but I want to find the best price.
- I want shoes, I know which ones and where to get them from.
Let’s also say you have the following campaigns/keywords set up to capture the following:
- I want shoes
- Campaign: Generic
- Keyword: Trainers
- I want shoes, I know which brand
- Campaign: Generic
- Keyword: Nike trainers
- I want shoes, I know which brand, but I don’t know which colour
- Campaign: Generic
- Keyword: Nike Airmax Size 9
- I want shoes, I know which ones, but I want to find the best price
- Campaign: Generic
- Keyword: Nike Airmax Black Size 9 cheap
- I want shoes, I know which ones and where to get them from
- Campaign: Brand generic
- Keyword: {YOUR BRAND} Nike Airmax Black Size 9
Let’s then do a major plot twist and say that the above is just one user journey; spanning a 90-day period of shoe-buying research and ending in a purchase from your company (woohoo)!
What happens when, after 30 days, you’re looking at your campaigns, all of which have high CTRs, great impression share, decent quality scores, reasonable CPCs and low bounce rates, but less transactions than you were expecting?
What happens when your client or your boss or the nosy neighbour next door complains that “Campaign C needs to be turned off immediately as it’s tanking our ROI”?
Or when you are told to just “keep brand running as it’s driving the best performance”?
Multi-Channel Funnel Reports
If any of this resonates with you, then you need to look at some of the greatest reports ever known to digital man/woman. That’s right, the multi-channel funnel reports in Google Analytics. Head over to this section in GA and look at the top conversion paths report and for the situation above you might see that whilst brand campaigns feature in most conversions, your generic campaigns are actually contributing as well, it’s just that they are further up the chain.
As a result, when your client, your boss or your nosy neighbour looks at the acquisition reports in Analytics and tells you that brand drove 75% of all revenue for last month, you can come straight back at them with the top conversion paths report, and back up your recommendation to keep running generic campaigns.
If you don’t see that, then your users are either purchasing by a currently un-tracked channel (e.g. over the phone, in store, or via a friend), or they’re not purchasing at all and there’s a problem with the price of your item or your website in general. But if that’s the case, at least you know it’s not necessarily your campaigns that are the issue!
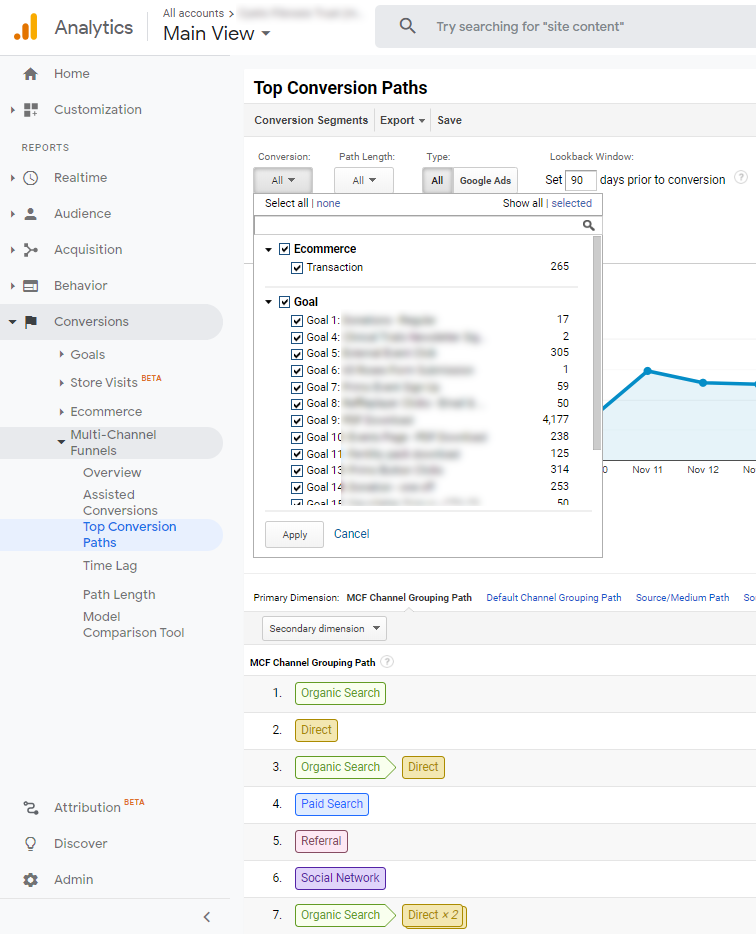
Using the top conversion paths report
Getting to and using this report in Google Analytics is dead easy. It sits under Conversions > Multi-Channel Funnels and once you get there, you’ll want to use the filters at the top of the report to choose:
- Which conversions you want to look at the path length (I typically choose all).
- Whether you want to focus on conversion journeys that include Google Ads or just all channels.
- How far you want your lookback window to be (typically I opt for 90 days).
Once you’ve done so, you can start digging into the details and using the primary and secondary dimensions and advanced filters to uncover a ton of insights. For example, I often change the primary dimensions to source/medium so I can see the exact traffic source and then experiment with adding campaign path, keyword path and landing page URL path to get the full picture.
What if the user journey is more complex than shoe shopping?
I used the shoes example because a lot of people have feet and buying shoes is a fairly easy process to understand. But what if you sell something more complex? What if the user journeys involved are far more detailed? What if Google Analytics multi-channel reports work for that too?
Let’s say you sell training courses and let’s also say that those training courses are not cheap. Let’s additionally say that some users do all the research and book training courses for themselves, and let’s thirdly say that other users do all the research and get someone else to book the course for them on their behalf. (Let’s also find a different way to phrase “Let’s say” whilst we’re at it.)
One could argue that the user journeys I’ve described above are complex, with the latter being particularly hard to even discover in the first place. But there is a report which can help here which is the time lag report.
The time lag report
With this report, we’re able to determine how long it takes for a user to complete a website conversion. It’s found in the same area as top conversion paths and has similar controls at the top.
Again, you’ll want to choose your conversion(s) – decide if you only want to see conversion journeys that include Google Ads – and then set your lookback window.
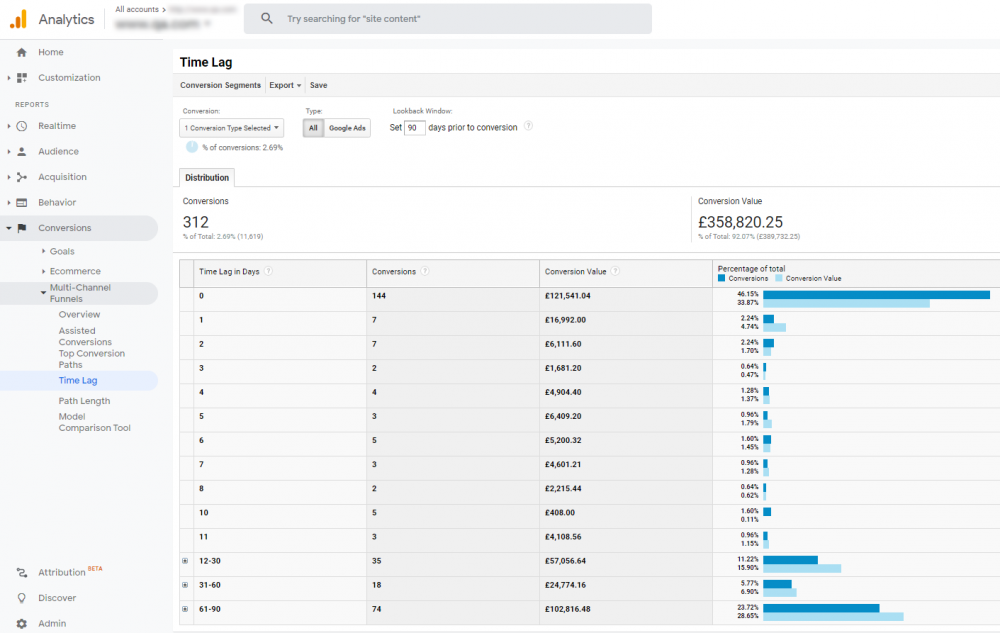
Using our training course scenario, we might find that 45% of all PPC revenue for the last 30 days happens on the first interaction with the site. But let’s say that the remaining 55% actually occurs 12-30 days after a user’s first interaction. If we use the filter controls at the top of this report to open up to a 90-day look-back window, we might find that an even larger portion or revenue is occurring between 12-90 days after the first interaction.
I’ve been through this exact scenario and was able to use both the time lag and top conversion paths reports to prove the efficiency of our generic PPC campaigns and highlight some interesting user journeys. For this client, it was still surprising to see such a high percentage of course bookings happening on the first interaction with the website, given that the average order value was £900+ and would typically require some research time across multiple sessions before making a purchase.
We used this report – along with client-side data and feedback from their sales department – to show that some of these users were simply returning after 90 days and therefore triggering a “new” session outside of the report, and that some were simply “bookers” who’s only action was to visit the site and pay for a course on behalf of someone else who has already done all of the research.
Had we not done this kind of analysis, we may have funneled more and more money into brand alone, and missed out on building incremental value by attracting new customers willing to convert.
Ultimately, we need to carry out user research via surveys and interviews to truly ascertain the common personas and conversion journeys for this website but thanks to these reports we’re able to make a better case for how valuable a project like this would be.
My favourite Hero Conf talks
At this point, you might be wondering what this has to do with Hero Conf? Well, I’ve picked out two of my favourite talks from Hero Conf, both touching on the importance of attribution.
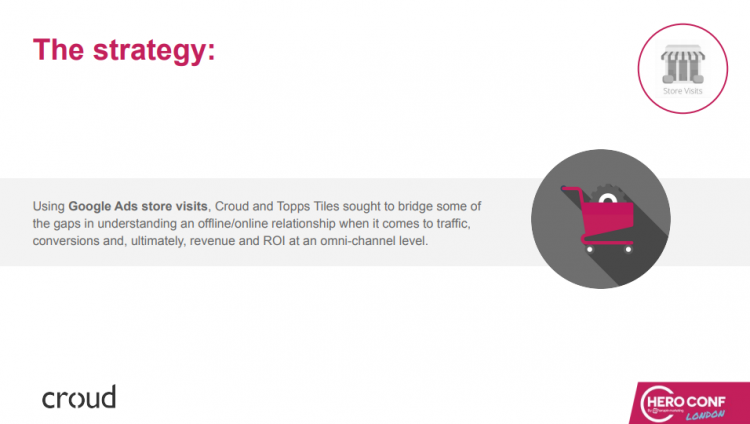
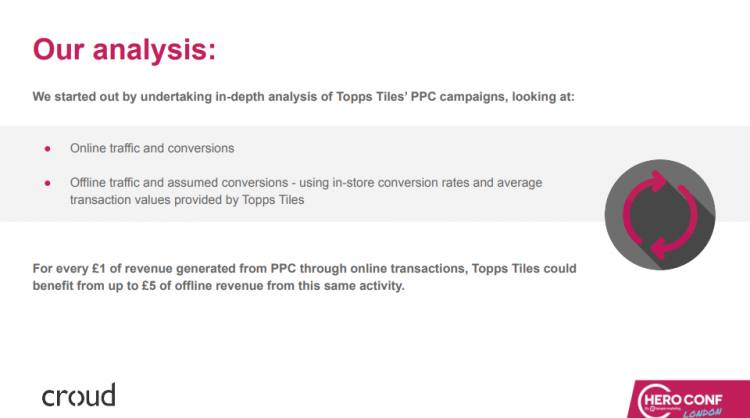
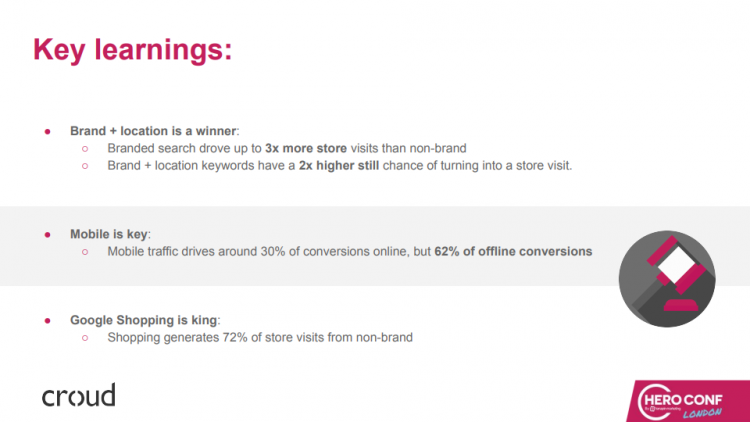
Bridging the gap between online marketing and offline behaviour – Katherine Sale
Katherine Sale at Croud Marketing covered the elephant in the room which is the joy of connecting up offline and online conversions. Her case study on Topps Tiles highlighted how she used store visit data to attribute offline purchases back to paid campaigns.
Stepping Beyond Data-Driven Models With A Markov Model Approach – Gianluca Binelli
I actually have the slides for this one!! Gianluca Binelli at Booster Box took us through typical attribution models and how we can use a method call Markov Chains to gain even more insight into conversion journeys. You’ll see some of the reports already mentioned in this article highlighted in his talk.
Broaden your campaign performance insight
How can you report on the performance of a campaign if you’re only looking at them with a narrow view?
Playing with attribution and using multi-channel reports help broaden that view and understand not only the role your paid campaigns play in conversions but how your marketing mix works as a whole. Kirk Williams over at Search Engine Land wrote a great article on the importance of good/danger of bad attribution, which is well worth a read!
We also have a free guide on Attribution, which you can download here.
If you’d like to talk to us about attribution modelling for your digital campaigns, get in touch today!