 Share
ShareIn the two previous blogs in this series – about a recent biometric research training week at the iMotions Academy in Copenhagen – I have covered the theory behind the different sensors and data being recorded, and also the practicalities of designing and running a study.
In this blog I would like to run through the example study we chose to conduct, and also explore some of the data and insights we gained.
What did our study look like?
The study we chose to conduct focussed on the user experience provided by the booking journeys of 3 major airlines. For the purposes of this blog, we will refer to them as airlines A, B and C.
For our study we asked 4 main questions:
- Which airline’s booking journey caused the most negative emotion?
- What stages in the booking journey cause the most frustration (negative emotion)?
- Which page elements can be considered pain points?
- How does negative emotional response impact the likelihood of using the airline in the future?
Participants were asked to book return flights between 2 locations. They were given instructions to select seats and take the cheapest baggage option.
We chose to record the following data:
- Eye Tracking – To identify users’ gaze and fixation points while progressing through the booking.
- Facial Expression Analysis – To establish engagement or negative emotion metrics.
- Galvanic Skin Responsive – To understand participant arousal during the booking process.
- Time on Task – The time to complete the booking process.
- Self Report – To understand the perceived ease of completion and likelihood of future booking.
We recorded data from 10 respondents which, while not a comprehensive sample, was enough to provide some initial findings.
What did our results look like?
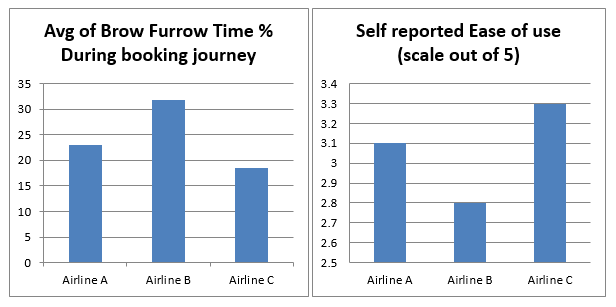
Our first finding was that booking journey of Airline B caused the greatest amount of brow furrow among participants. This indicates that users of this airline had to concentrate more when making selections, and our hypothesis is that this increased brow furrow was mainly driven by Airline B having a more intricate interface with smaller font sizes and clickable areas than the others. This correlated with the user surveys, where Airline B received the lowest ease of use rating.
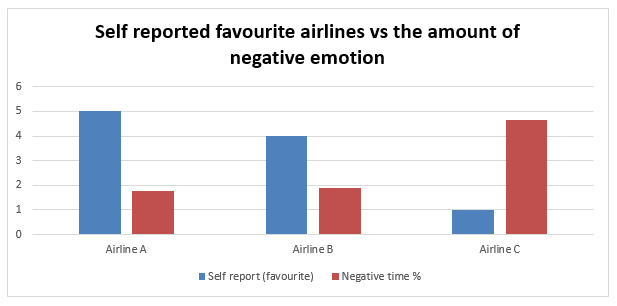
Our second finding was that Airline C caused the highest amount of negative emotion overall. This, we felt, was partly caused by Airline C failing to have a “London (any”) option in the flight selection pane, which meant users had a more difficult time finding a suitable route.
As part of our post exercise survey, we also asked users to select their favourite airline based on the experience. In the data, there is a correlation between the self-reported favourites and the high amount of negative emotion detected in the facial expression analysis.
Honing in on how participants were engaging with the interfaces on the airline websites through eye tracking data, we were able to identify that on Airline C’s first page, it took users an average of 75 seconds to select a destination and fixate on the CTA to move forward, whereas participants using Airline B’s website were able to achieve this in half the time, highlighting that even with a smaller interface, the inclusion of a general option for “All London Airports” allowed users to progress with their journeys faster, and – with some likelihood – helped to bring down negative emotion across the entire journey.
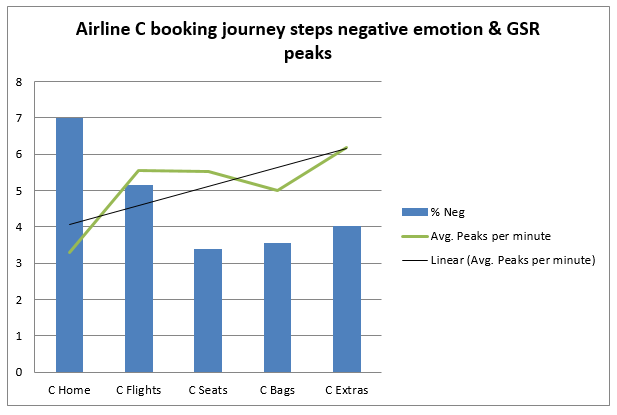
Taking the journey of Airline C in terms of steps, we were also able to see that, throughout, there was a relatively high negative emotion. Participants also exhibited increased emotional arousal as the task wore on, potentially identifying how frustration and annoyance levels increased as participants progressed through the journey.
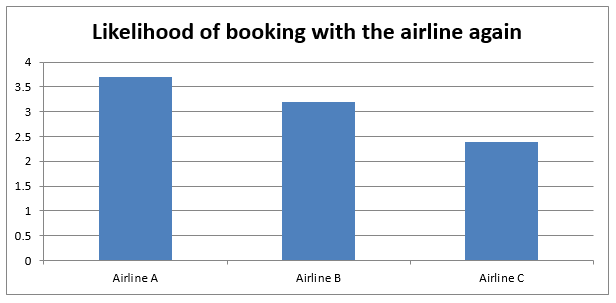
Finally, users were asked to provide their likelihood of booking with the airline in the future based on the experience of using the website. Just like the self-reporting of the participant’s favourite website, there was correlation between a strong negative reaction to the experience and the likelihood of booking again, with Airline C performing most poorly.
Thanks to the framework and theoretical knowledge gained in the earlier parts of the Academy, we were able to take some interesting findings from our study. This outcome, however, is only possible as a result of comprehensive study design and making sure that as a researcher, you have a clear idea of what insights you need to get out of a study before beginning your research.
If you’re interested in seeing how biometric research could be used for your business, or just want to get a feel for how we can create a bespoke study based on the insights you would like to achieve, contact us today.