Share
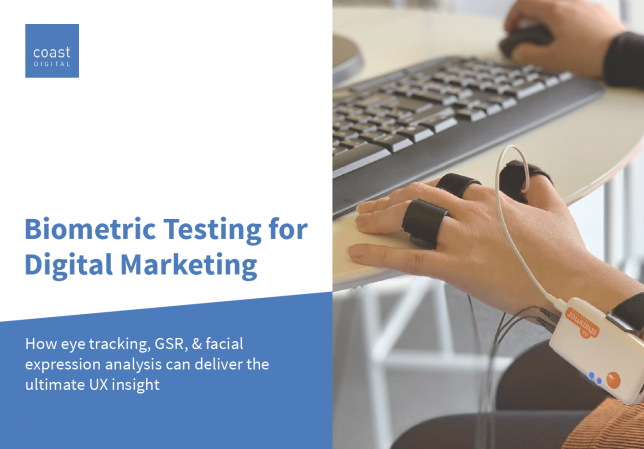
ShareBiometrics has certainly been a hot topic here at Coast of late. With the acquisition of our lab equipment, the UX team have been extremely excited about the prospects of digging deeper with our user research and accessing an additional level of data to quantify engagement and emotional responses.
As part of our commitment to better understanding the technology and the data it offers, myself and Analytics Specialist, Funmi Sobodu, were lucky enough to be sent over to Copenhagen for a week of intensive biometrics training with the team at iMotions.
![]()
The week was split into 2 halves. The first half was theory heavy, with interesting lectures into the various data we have available to us when using the biometric recording equipment. This included:
- Eye tracking (ET).
- Facial expression analysis (FEA).
- Galvanic skin response (GSR).
- Electroencephalography (EEG).
The second half of the week was much more practical, where in teams we were tasked to design a biometric research study, collect data and then crunch the numbers for a presentation on the Friday afternoon.
Learning the theory
So far at Coast we have built a good understanding of the principles of recording data and conducting studies, but in-depth tuition is always welcomed.
![]()
Starting with eye tracking (ET) on day 1, we were given a breakdown of how the technology works. Essentially, infrared light is used to illuminate the eye, this light identifies the pupil and reflective points on the eye and then, through some clever triangulation, it calculates the direction of the gaze. This in turn provides insight into a user’s fixations (points where gaze is maintained) and saccades (the bits in between where our eyes jump from A-B).
The types of outputs possible from ET were also highlighted:
- Heatmaps – plotting the density of aggregated fixations which can be used as an exploratory tool to understand popular points on a page.
- Gaze replays – where people look and for how long they may fixate on a single point in sequence.
- Bee swarms – aggregated gaze replays neatly showing how multiple participants may look around a stimulus.
- Areas of interest – manually added areas giving stats such as the time until first fixation and the time spent looking at a particular area of a page – extremely useful when analysing how long it takes for a user to reach a call to action, for instance.
We also learnt that in biometric research, however, it is often not about the results from one sensor. More frequently, it is the combination of different sensors and data sources that allows the bigger picture to be understood.
Facial expression analysis (FEA) is another of the data sources that was covered during the Academy. We learnt about how the facial expressions made by the participant are recorded as they are exposed to stimuli and, through running this video feed through an algorithm, the system is able to give a quantifiable probability of the emotion being felt. It does this by measuring and combining actions such as frowning, raising of our eyebrows and how we pucker our lips to build seven basic emotions:
- Joy.
- Anger.
- Surprise.
- Fear.
- Contempt.
- Sadness.
- Disgust.
These metrics can be used to analyse the emotional response to adverts or the user experience provided by a website; or, if a broader metric is required, FEA can deliver an idea of the valence (positive or negative emotion) that is expressed when users are exposed to a stimulus.
Day 2 of the Academy ramped up the technical understanding by looking at galvanic skin response (GSR) – measuring the conductivity of the skin based on the sweat response to certain stimuli. While relatively new to us, it is by no means a new technology and has been used for over a 100 years in psychoanalysis, with Carl Jung referring to it as “a looking glass into the unconscious.”
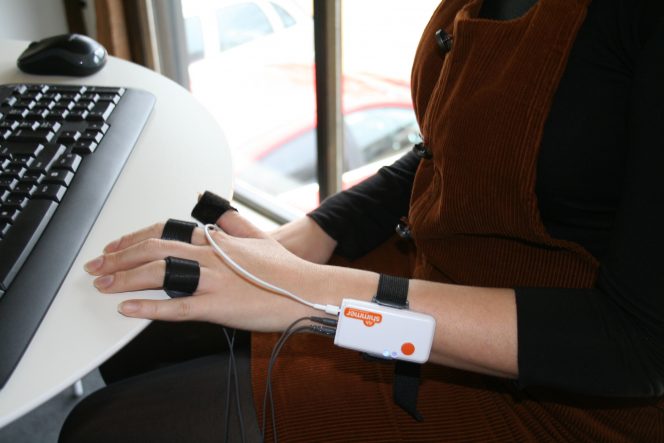
The reason GSR is measured is because in its attempt to return us to a ‘normal’ state, our bodies sweat, regulating our internal temperature in response to an emotion or external stimuli. Put simply the more we sweat, the greater the arousal.
While FEA can give us an impression of what emotion is being felt (or if it is positive or negative), GSR gives us the strength of the emotional arousal, adding another level of detail to our understanding of a participant’s response.
The final lecture on the data sources covered electroencephalography (EEG) which, it is fair to say, is the most complex of the sensors available. EEG essentially measures cognitive processes in the brain through the electrical signals that the brain produces, and can give good insights into how alert, engaged or motivated a participant might be.
EEG provides extremely good temporal resolution (i.e. it is very good at telling us when something is happening in the brain) and therefore it can be used to see how the brain reacts to stimuli with a good degree of accuracy.
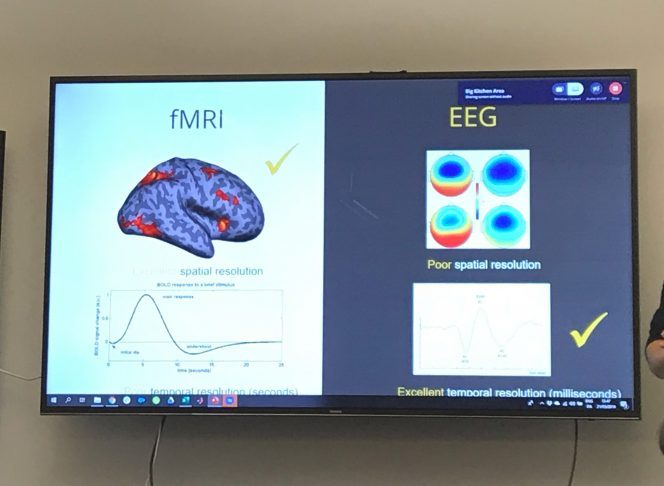
During the Academy, we discovered that EEG raw signals are very noisy – making it difficult to gain any insight from them. Signals, therefore, must first be decomposed into waves (alpha, delta and theta for instance) which can then be interpreted a little more.
Finally, we learnt that applying a metric such as frontal asymmetry can give a layman’s view of whether the participant is experiencing an approach or avoidance motivation, with a higher approach value relating to a positive response from the participant.
While complex, the EEG lecture was fascinating and gave a good understanding of how powerful biometric research can be.
Bringing it all together
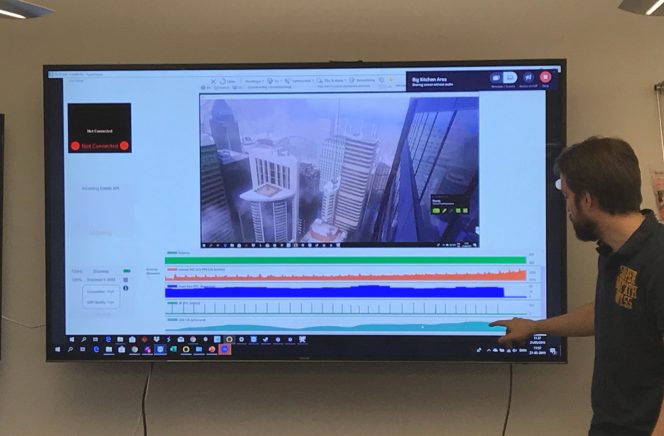
At the end of 2 days of lectures we were then able to bring the different data sources together in a test assignment which looked at various Super Bowl ads.
Combining the data from all the sensors with some pivot table magic, we were able to make some genuine insights into which ads achieved the most positive responses, how participants reacted to certain artistic choices (musical numbers versus scripted jokes), the impacts of celebrity endorsement and even how people tend to react to the types of products being advertised (in this case: beer, chips and financial apps).
Analysis however, is for another blog… in the latter half of the week, we designed and completed our own study, which I will cover in another post soon.
If you’d like to learn more about biometric research and it’s application to UX design and digital marketing, we have a free guide available for download – Biometric Testing for Digital Marketing.