 Share
ShareAs part of my two-year computer science course, we’re put in contact with someone that has suitable experience to aid us in a variety of things (such as career choices).
I’m the lucky mentee of Daniel James, a developer at Coast Digital. In addition to the mentor scheme, we had to complete a month-long internship at a relevant placement; Dan was very helpful in providing Coast Digital as my work placement!
Having met up with Dan a few times previously, I knew that he worked with WordPress, which I’d never used before and was a bit apprehensive going into it on the first day.
Luckily, the dashboard-type project Paul Coffey designed didn’t need any sort of Content Management System, so we decided to go with standard HTML, CSS and JS, which I’d done lots of before – much more familiar!
The Early Stages
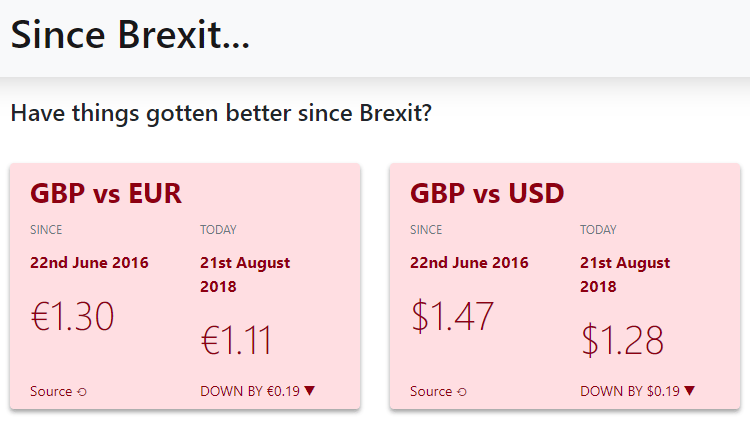
The project given to me was thought up by Paul, Coast Digital’s Production Director. The project was a mobile-first, card-based website that would show a variety of real-time figures relevant to Brexit – stuff like the value of the Pound, UK GDP etc.
Web Designer Sadie drew up an initial page design and I got to work building the basic card layout, with the help of Bootstrap. Using this saved me a lot of time writing media queries and other styling, which I don’t enjoy as much as the JavaScript stuff.
During the first week, in between working on the project, I had various chats with employees at Coast, where they sat down and gave me an overview of what they do for Coast, which were great because I wasn’t aware of all the different components that go into digital marketing.
At the end of the second day, I got the website’s basic look drafted, but it lacked functionality and there were some layout inconsistencies – here’s what it looked like.
Finding Data
The only data source I had worked on by the end of the first week were exchange rates – two cards on an entire page isn’t exactly extensive, so I went on the search for more data, which turned out to be one of the most difficult parts of the project.
For a government that’s trying to push forward the idea of open, up-to-date and free data, there’s very little of it about.
The only useful stats I could find on the UK Government website(s) is unemployment rate, which only updates at the end of each year. The rest of the data I had to get from other APIs, often with limited access; I had to enter the data manually (ugh!), or use screen scraping.
Luckily, all the of the methods I found returned data in JSON format, which works great with JavaScript.
Using the Data
Once I’d found the data, the next challenge was how to use it.
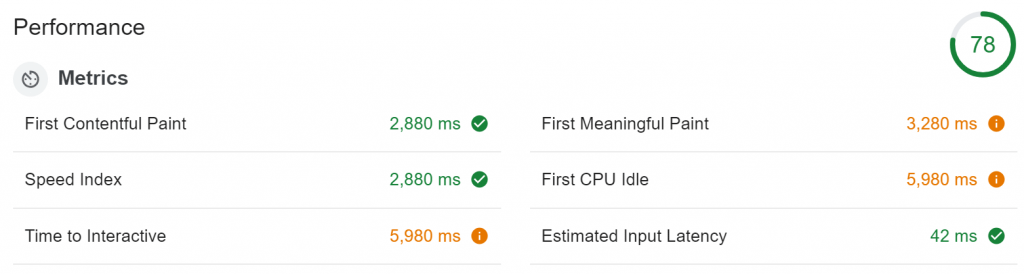
At first, when testing the APIs, I was making all the requests from the end-user directly to the APIs. This worked fine for just the single rate per card, but became problematic when implementing the chart feature.
This is because the amount of requests needed to plot one makes for very slow loading.
The Chrome Lighthouse audits show that it wasn’t as performant as possible in relation to a number of important speed and loading metrics.
Seeing as the charts were going to be the same for each client, the requests didn’t need to run on the user, but could run on the server with data in a .json file – allowing the user access to the content much faster. So, I re-wrote the fetching scripts in a node.js one; a node is a runtime environment that allows JavaScript to run outside a browser, i.e. a server, which is handy since I don’t have a clue about writing PHP!
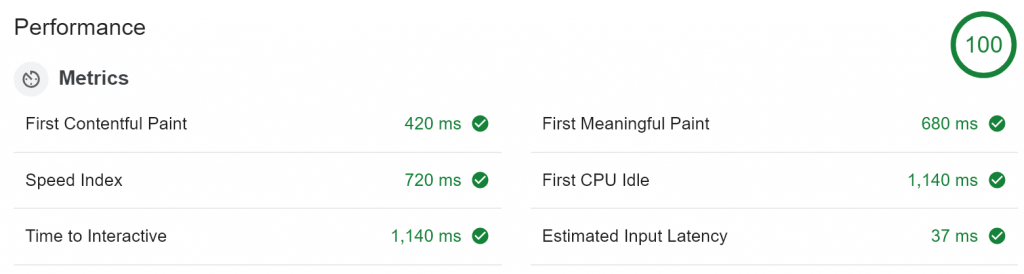
Running the performance audit again showed that we’d made vast improvements over the previous methodology!
Refinements
By now, I had all the data and it was displaying fine on the screen, but it was all a jumble of poorly named variables and slightly different functions. Fortunately, I had quite a bit of time left, so I decided to ‘clean up’ the code; which, for me, is simultaneously very tedious yet oddly satisfying.
This meant reprogramming the node scripts to format the data consistently so that the client script can use the same code for each rate.
Now that everything runs through the same functions, it’ll be a lot easier to maintain and add cards in the future, as well as running faster than it would otherwise.
I’m happy with how this project has turned out, and I learned a lot about APIs, JavaScript and general web development. It’ll all be transferrable into my second year of college and later life if I choose to go into something like this.
The details of my work at Coast Digital will also be a great addition to my portfolio for when I’m applying for jobs in the future, as I rarely create something that I’m truly proud of when I’m at college.
In conclusion, I’ve really enjoyed my time as Coast – it’s given me priceless experience and a great insight of what it might be like to work in web development and digital marketing. I think that it’s going to really benefit my last college semester and the choices I make going forward.
The project is here if you want to try out what I’ve been working on for the past month. Each statistic updates on an automatic, daily basis to provide the latest important statistics worth measuring since Brexit. Thank you and enjoy!